01Monthly Report
Paper report · colorful charts · a month in review
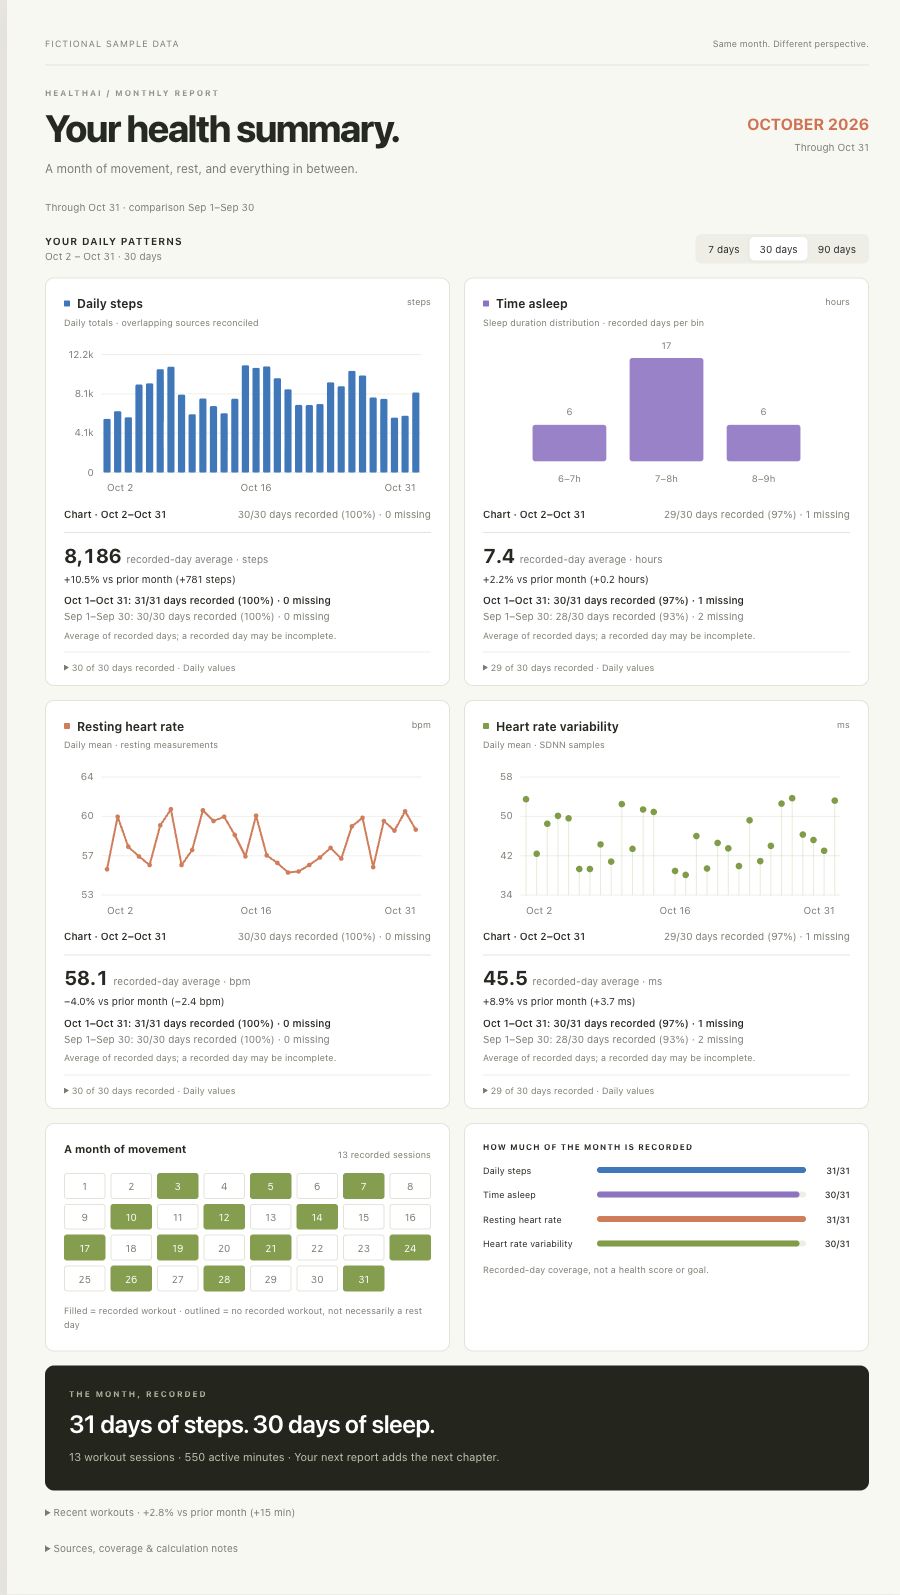
healthai dashboard export.zip --template report← Apple Health Data · CLI guide ↗
Turn your Apple Health export into a private, offline dashboard for steps, sleep, resting heart rate, HRV, and workouts. Explore three visual perspectives, plus Field Notes, then create your own with the free, open-source healthai CLI.
All previews use the same 90 days of fictional sample data, with October 2026 as the monthly overview.
Create your dashboard — setup guide ↓ · Watch the 31-second promo
healthai dashboard export.zip --template report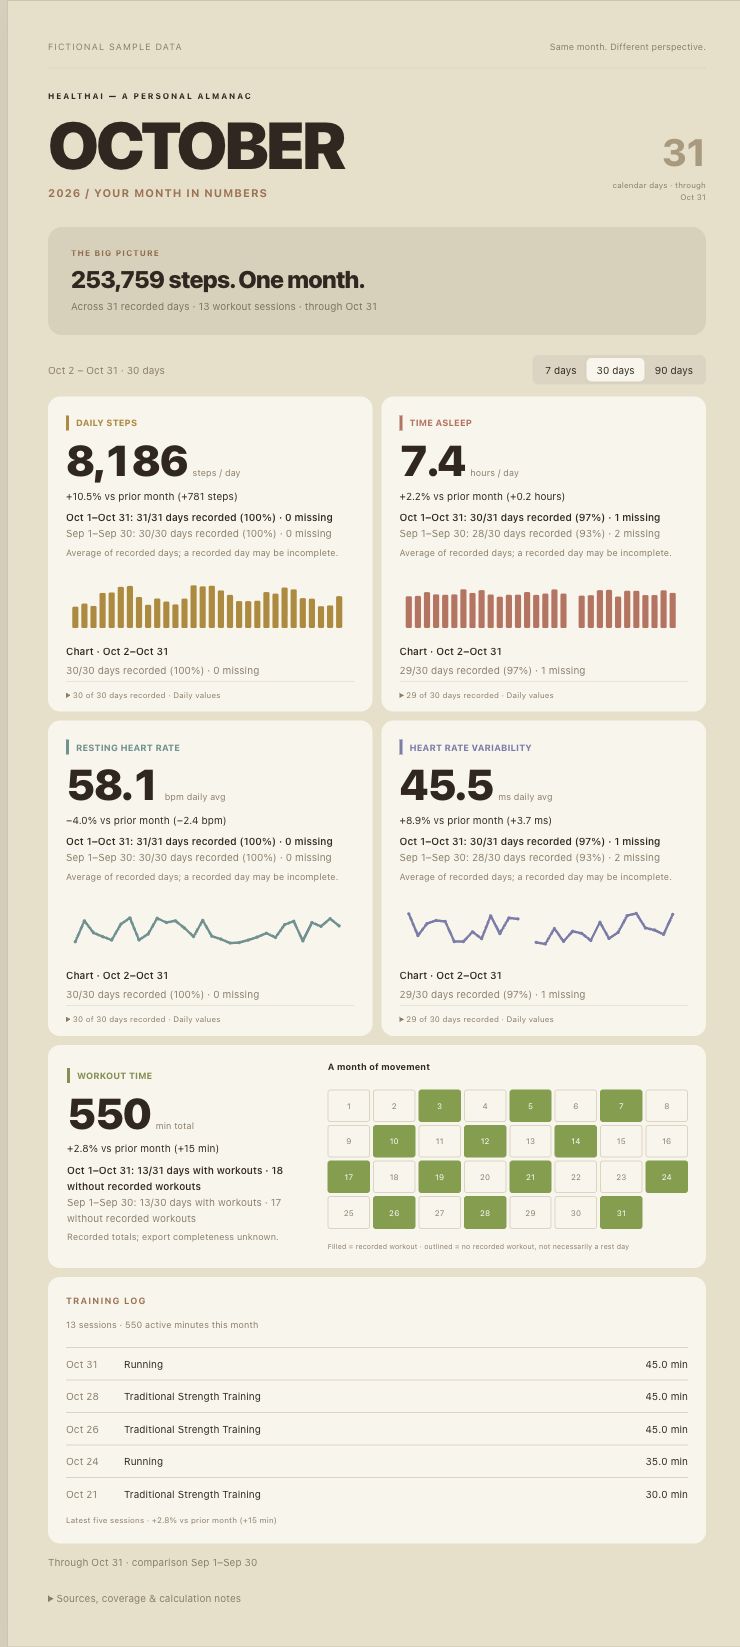
healthai dashboard export.zip --template recap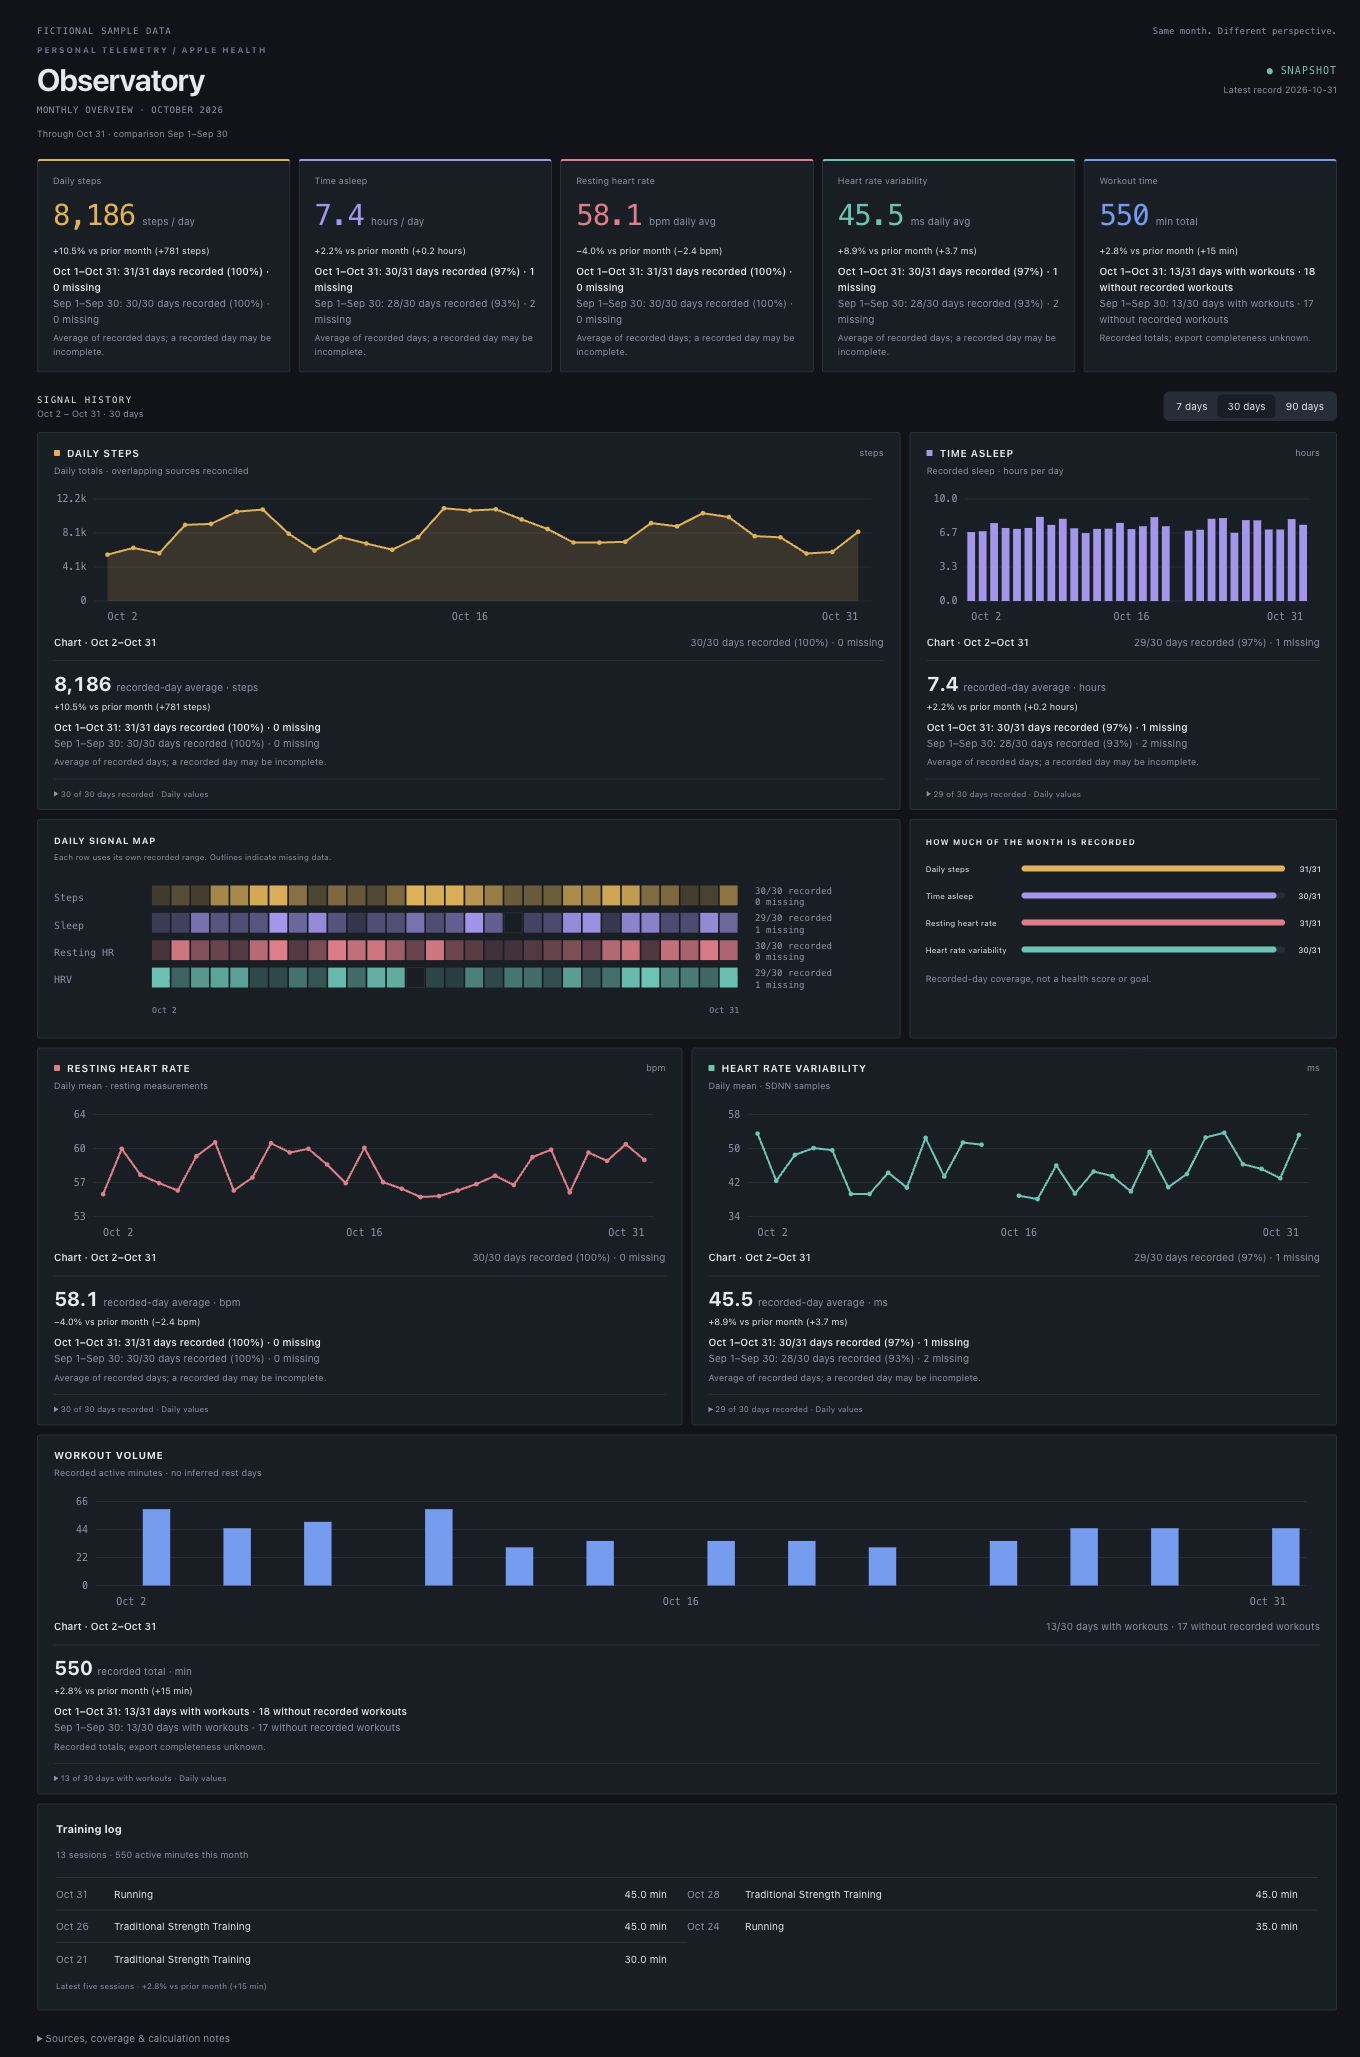
healthai dashboard export.zip --template observatoryCHOOSE YOUR VIEW
Every template uses the same data and calculations. Choose a layout, then switch views inside your generated HTML file without importing your export again.
| Template | Useful for | What you see |
|---|---|---|
| Monthly Report | A compact monthly review | Daily charts, sleep distribution, a workout calendar, and coverage summaries. |
| Monthly Recap | A month at a glance | Large headline numbers, small trend charts, and a warm portrait layout. |
| Observatory | Inspecting daily patterns and gaps | Dark chart panels, a daily signal map, workout volume, and per-metric coverage. |
| Field Notes | A quieter journal-style review | An editorial layout with monthly summaries, daily charts, and calculation notes. |
Daily steps, time asleep, resting heart rate, heart rate variability (HRV, SDNN), and workout minutes. The charts offer 7-, 30-, and 90-day views; monthly summaries compare the same elapsed days of the previous month, capped at its end.
All four layouts show recorded and missing days beside their charts. Averages use recorded days; missing measurements stay as gaps. Daily-metric changes require at least 7 recorded days and 80% coverage in both comparison periods. This is a display rule, not statistical confidence. A recorded day may still be incomplete.
Workout totals count recorded events. A day without a workout does not establish missing data or a rest day.
Dashboard generation runs locally without uploads, an account, or an AI API key. The output is one offline HTML file. It contains health summaries and source names, so anyone you share it with can read them. The public examples on this page use fictional data.
FROM EXPORT TO DASHBOARD
Use Apple’s built-in export and the free, open-source healthai CLI. Dashboard generation does not require the paid app or an AI subscription.
On your iPhone, open Health → Summary → your profile → Export All Health Data. Transfer the resulting export.zip to your computer. The CLI accepts that ZIP, an export.xml file, or an export directory. See our Apple Health export guide or Apple’s export instructions for more detail.
These commands are for macOS or Linux with Python 3.9 or newer. They create an isolated environment and install the dashboard release. Installation downloads the package and its dependencies.
python3 -m venv .venv
.venv/bin/python -m pip install https://github.com/krumjahn/applehealth/releases/download/v1.12.1/healthai-1.12.1-py3-none-any.whl
On Windows, create the environment with py -m venv .venv, then use .venv\Scripts\python.exe and .venv\Scripts\healthai.exe in place of the commands above and below. Full CLI instructions and source code ↗
Start with the fictional demo, then point the command at your own export. This example chooses the black Observatory template.
# Try it with fictional data
.venv/bin/healthai dashboard --demo --template observatory --out demo.html --open

# Create your own dashboard; adjust the export path
.venv/bin/healthai dashboard ~/Downloads/export.zip --template observatory --out my-health.html --open
Use --template report, --template recap, or --template field-notes to choose another starting layout. You can also switch templates inside the file and use Print / Save PDF in your browser.
By default, the report uses the latest supported month in the export. Add --month 2026-10 to select a month. Generate a new file from a newer export to refresh your data; choose a new output filename each time.
BEFORE YOU START
Yes. The generated report is a standalone HTML file you can serve from your own web server or static host. You can also open it directly on your computer without running a server. If you host personal health data, use access controls or publish only information you intend to make public.
No. Each dashboard is a snapshot of an export, not a live connection to your iPhone. Export again and regenerate the HTML when you want an updated report.
Your export may not contain that metric for the selected period. A comparison is also withheld when daily coverage is too sparse or the prior value is zero. Check the dates, recorded-day counts, and calculation notes in the report before interpreting a change.
No. These dashboards visualize recorded measurements and their coverage. HRV is reported as mean daily SDNN, not a proprietary recovery score. The charts do not establish that a habit caused a change.